Watching the Detectives
There are many ways to understand a community.
For instance, Kevin Ottens has been writing about understanding the KDE community by the "green blobs" method, showing who is active when. Lays Rodrigues has written about using Gource to show Plasma growing up. Nate Graham describes the goings-on in the KDE community nearly every week.
Those are, roughly: a metric-, a visual-, and a story-based approach to understanding the community, over different timescales. But understanding of a system doesn't come from a single dimension, from a single axis of measurement. It comes from mixing up the different views to look the system as a whole.
To that end, I'm going to apply Kevin's and Lays's approaches to .. well, not to something Nate has written, but to a recent this-week-in-Elisa post by Matthieu Gallien. The relevant period is april 22nd (the release of Elisa 0.1.1) to may 16th (latest post on Elisa progress).
ComDaAn is the toolbox Kevin has come up with for dealing with activity and centrality. It's a Python3 application -- it almost works with Python2, except that timestamp-formatting in Python2 does not support the %z flag (in spite of the documentation). No strange dependencies, and easy_install or system packages get everything (even on FreeBSD). The green-blobs tool is called activity.py and can take a date range to limit what is shown, for instance ComDaAn/activity.py -f 2018-04-21 -u 2018-05-16 ~/src/kde/elisa/ , which gives us this (image links to an actual HTML page with all the fanciness).
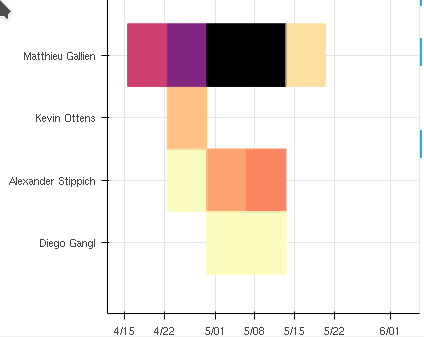 Elisa Contributors, 2018-04-22 -- 2018-05-16
Gource is what Lays used to show off Plasma development. I used the same video (regenerated locally) as a blinkenlights show at the KDE booth at FOSS-North. Gource also takes a date range, for instance , which gives us this (image links to the video).
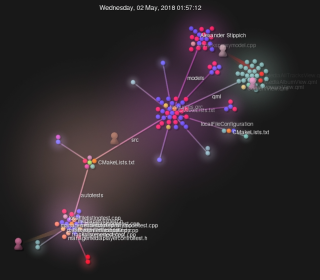 A moment in Elisa time
The time period here is short; it's unwise to draw any conclusions from any of these visualisations. They do support the story that Matthieu tells, and the natural order of things is that the main developer does the most commits, with features and fixes coming (ir)regularly from others. The movie shows that the structure of Elisa (or the source code, at least) remains stable over this period. Together, the visualisations along different axes enliven the story of Elisa -- and running those tools over a longer period of months can help understand how the community around that application grows and changes.
[[ As an aside, there's a really neat use of Gource out there: instead of visualising source-code changes, use it to watch other kinds of events, like those that DTrace can provide from a running system. FreeBSD users can enjoy Devin Teske's dwatch-gource, which uses dwatch to produce logs suitable for gource, and then make a movie of what their system is doing. Maybe not great for parties, but excellent for figuring out why the desktop is suddenly slow while building Qt, LLVM and GCC in parallel (all three with -j8). ]]